


Complementary Material
- Departamento de Informática
- Control, Learning and Optimization of Systems (CAOS)
- Research
- Complementary Material
-
Emergency Strategy Selection Based on Self-Awareness in Autonomous Vehicles
Figure 3: Previous testing platform and the new perception system
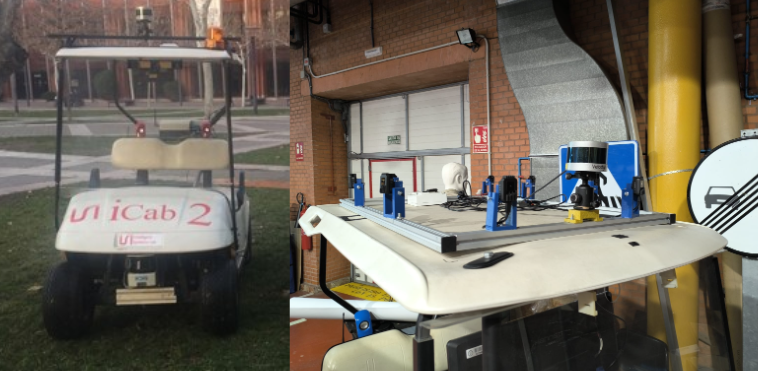
Figure 3: Previous testing platform and the new perception system.
Figure 4: Plan of the proposed experiment and the resulting odometry.
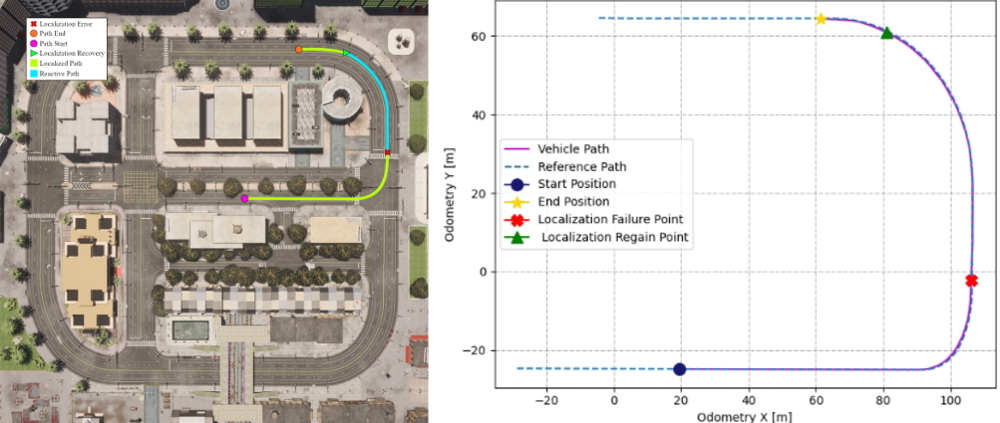
Figure 4: Plan of the proposed experiment and the resulting odometry.
Figure 5: Vehicle speed and behaviour signals during the test.
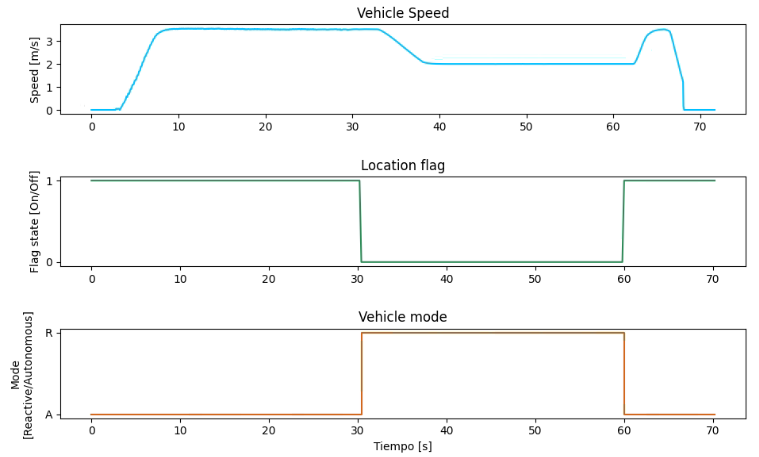
Figure 5: Vehicle speed and behaviour signals during the test.
Figure G.1: Aerial comparison of the real campus and the simulated model.
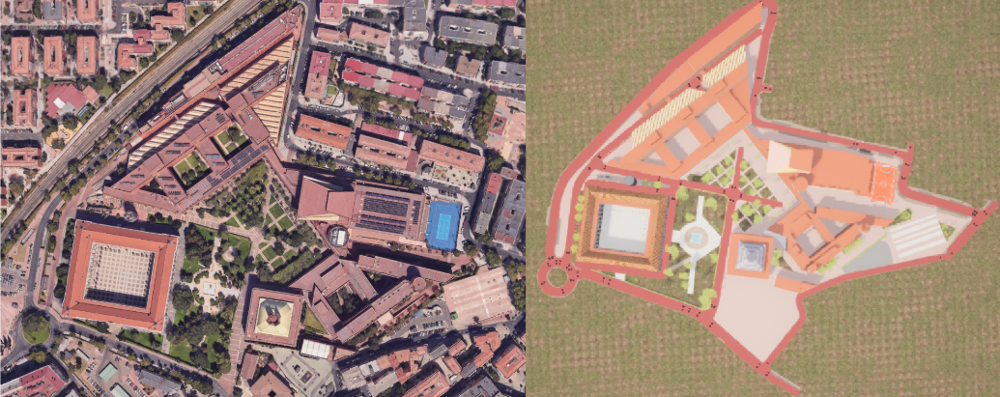
Figure G.1: Aerial comparison of the real campus and the simulated model.
Figure G.2: Sample of the creation of driving lanes.
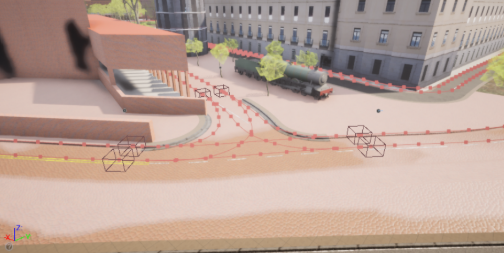
Figure G.2: Sample of the creation of driving lanes
Figure G.3: Simulated model of the real experimental vehicle.
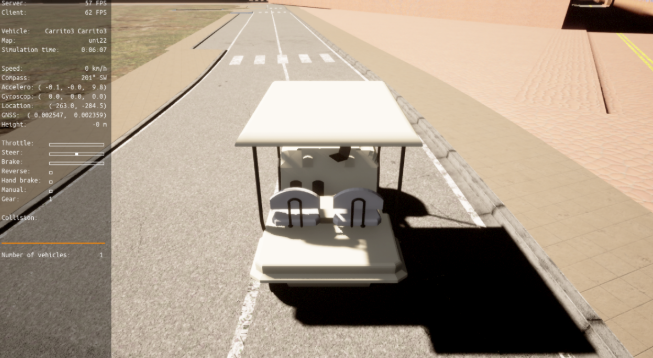
Figure G.3: Simulated model of the real experimental vehicle.
-
Reservation Based Intersection Arbitration with Behavior Cooperation and Time Optimization
Figure 6. Intersections
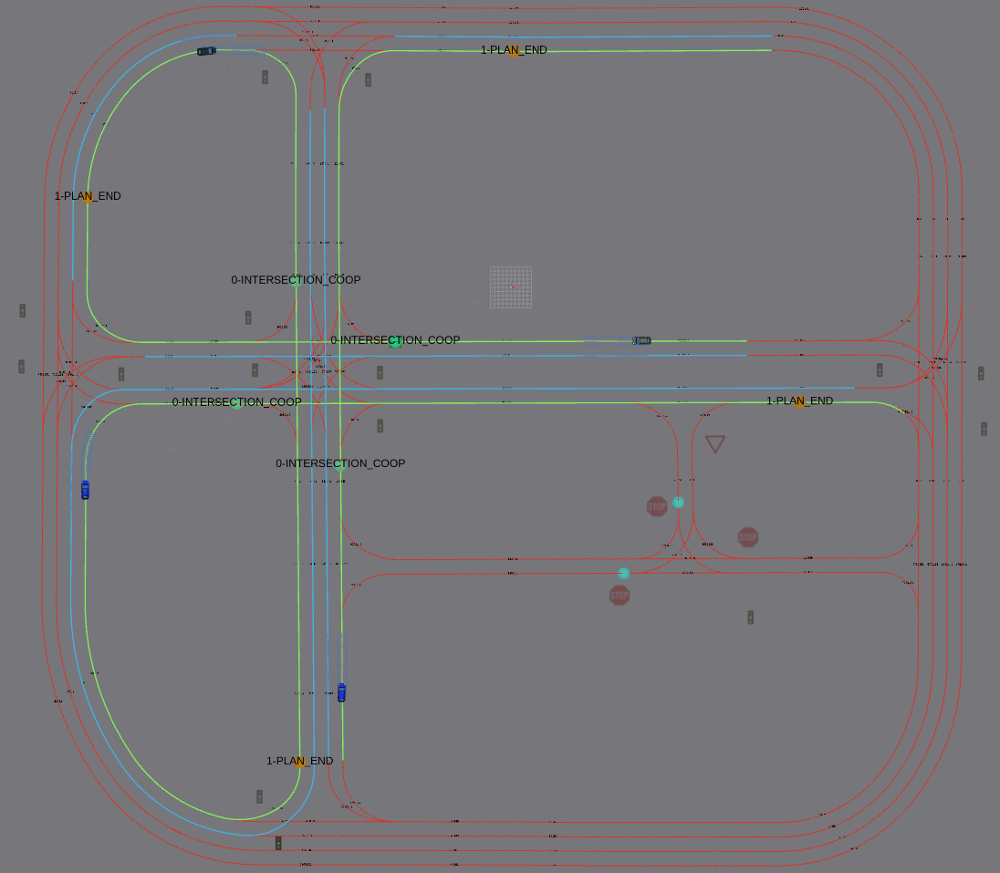
Figure 6a - Intersection Scenario
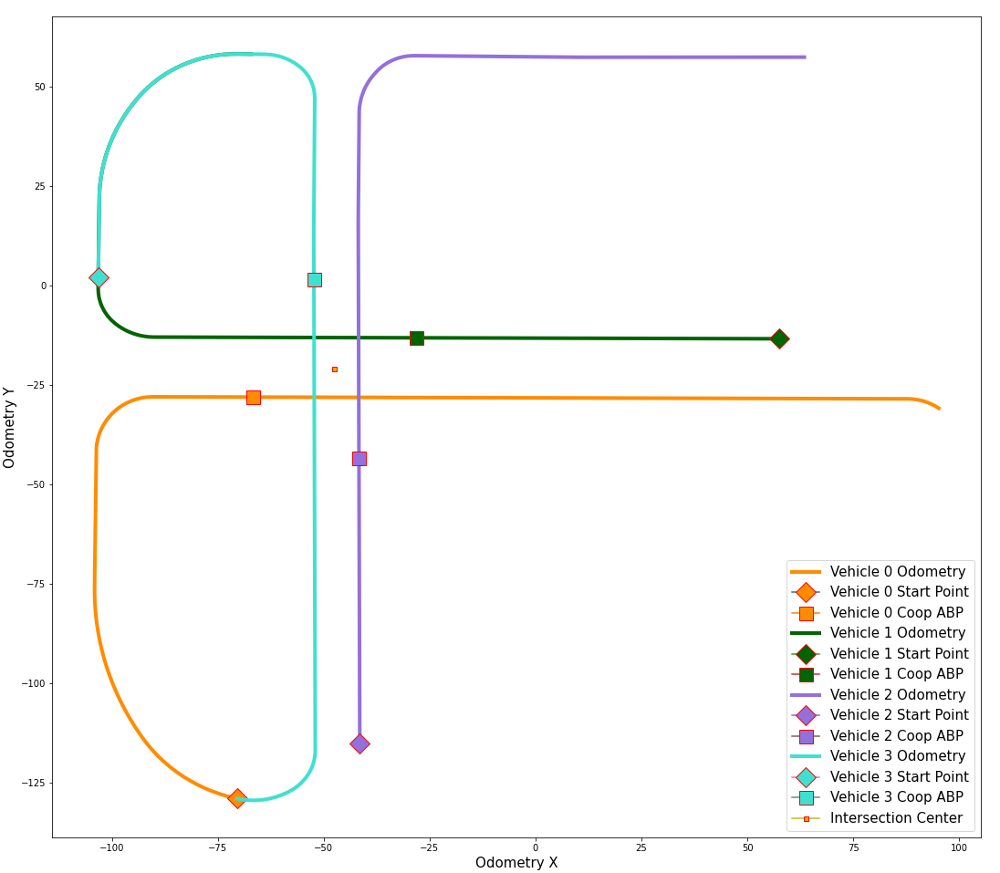
Figure 6b - Intersection Odometry of each CCAV.
Figura 8. Arbitration
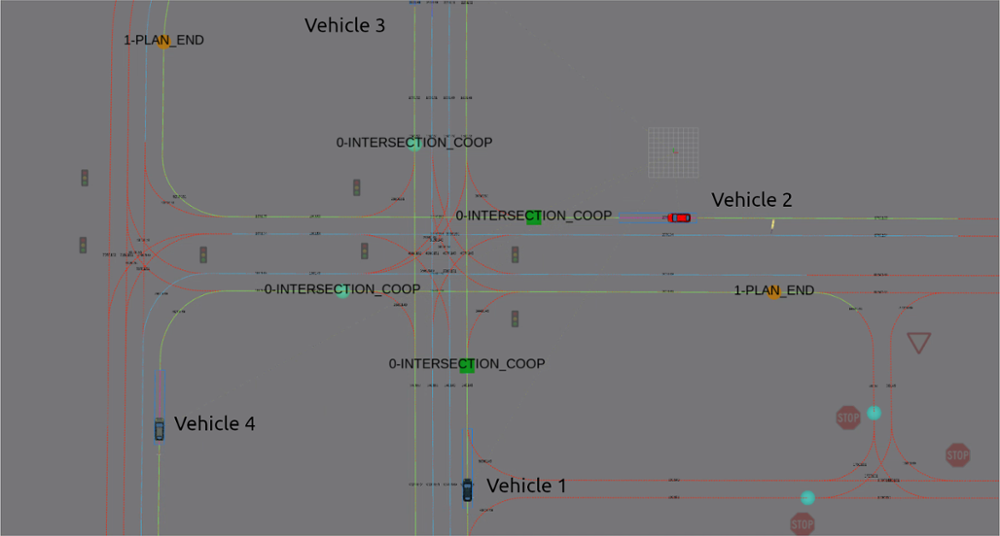
Figure 8a - Vehicles Approaching the Intersection
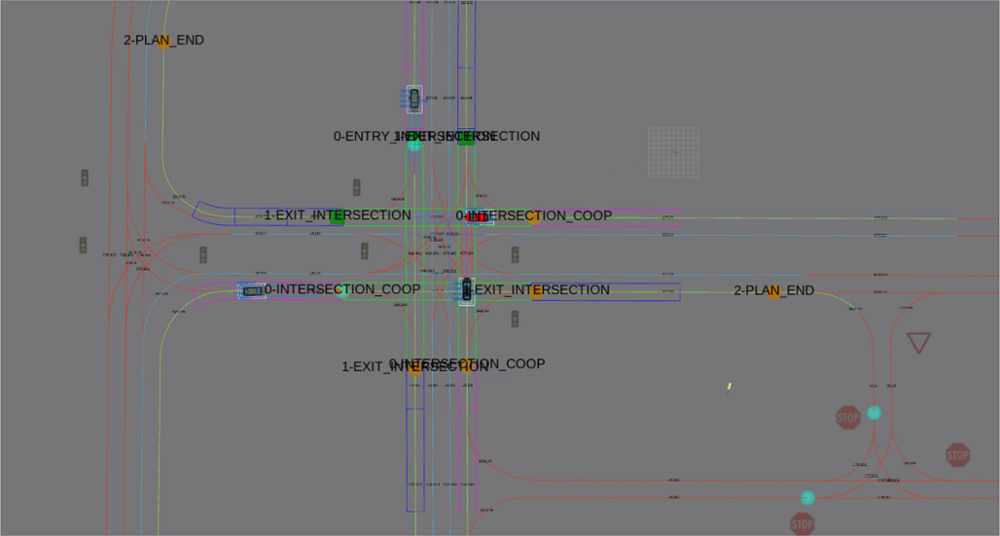
Figure 8b - Vehicles Arbitrated for Entry
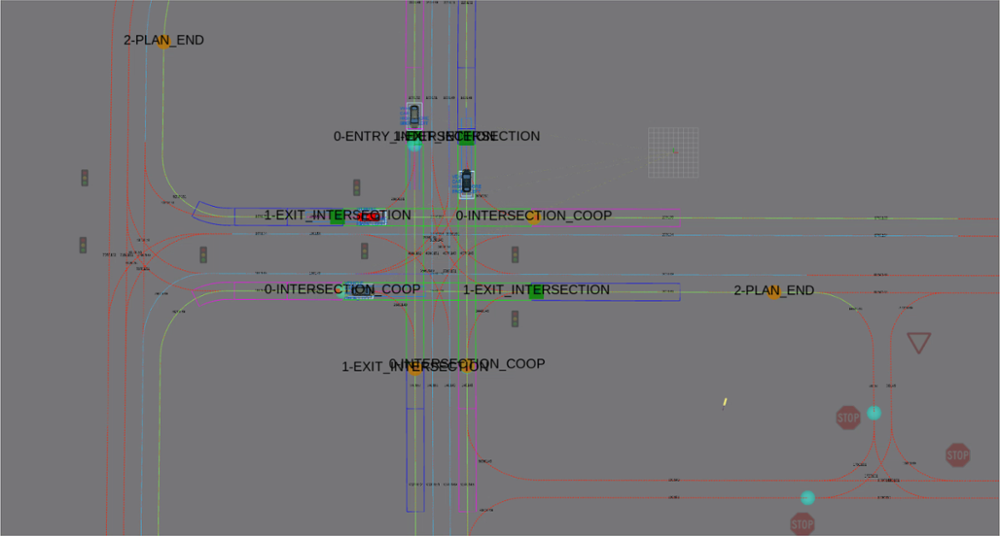
Figure 8c - Vehicles arbitrated for Stop
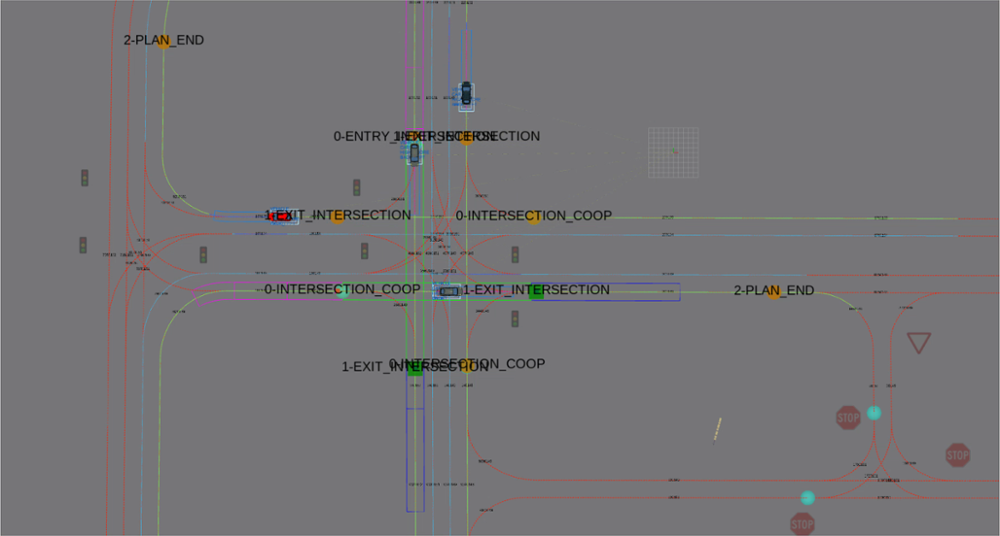
Figure 8d - Final Stage of Arbitration
Figura 9. Roundabout
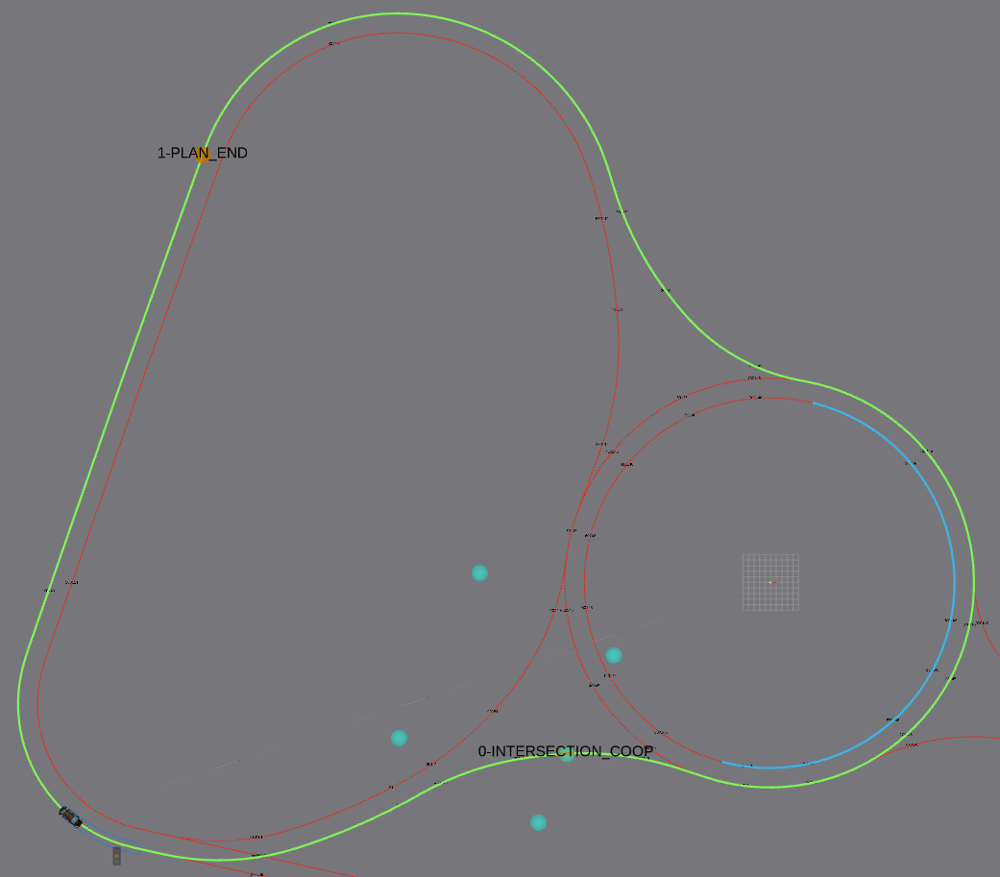
Figure 9a - Roundabout Scenario
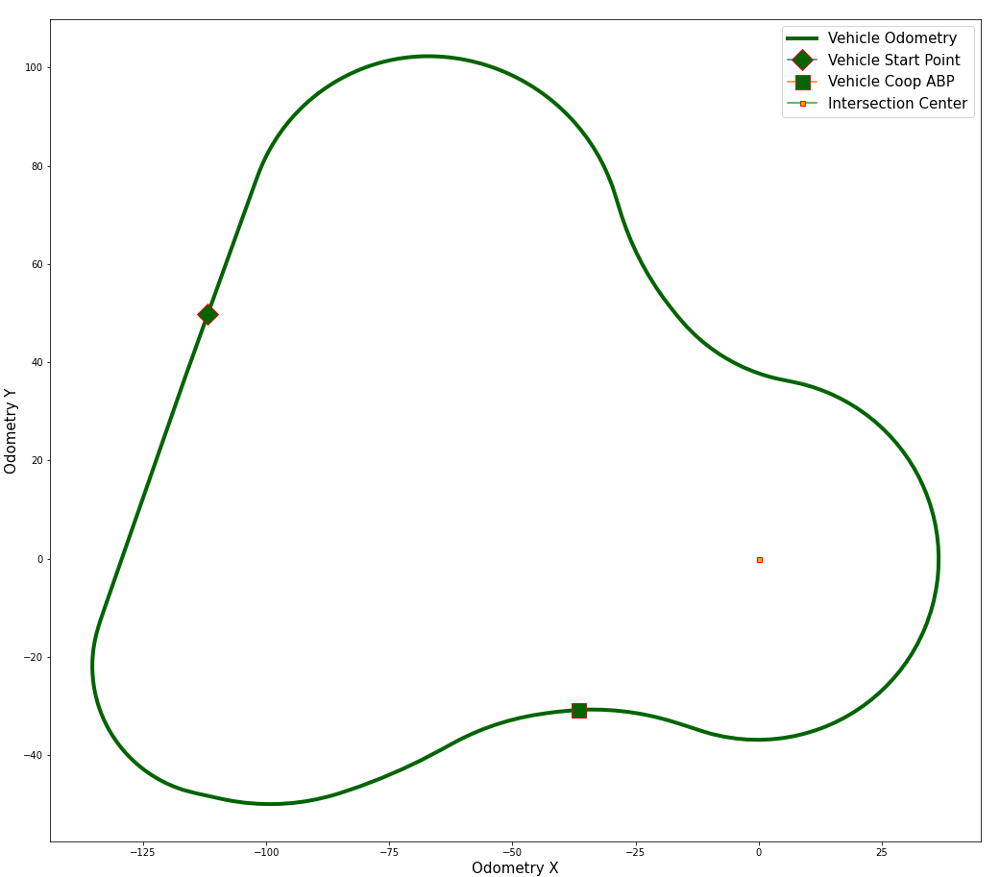
Figure 9b - Roundabout CCAV Odometry
-
Behavioral Based Decision-Making Scheme for Cooperative Connected Automated Mobility.
Figure 3. Carla world experimentation use cases.
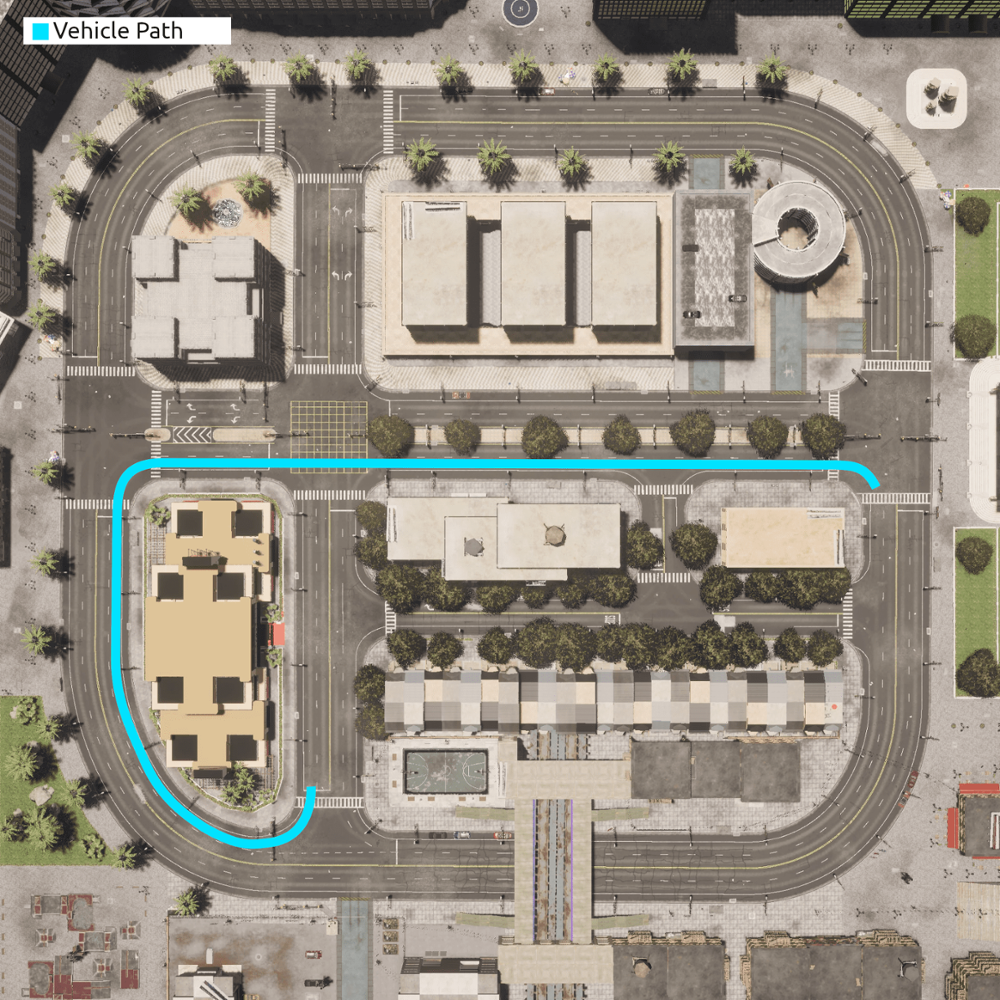
Figure 3a. Custom ABP
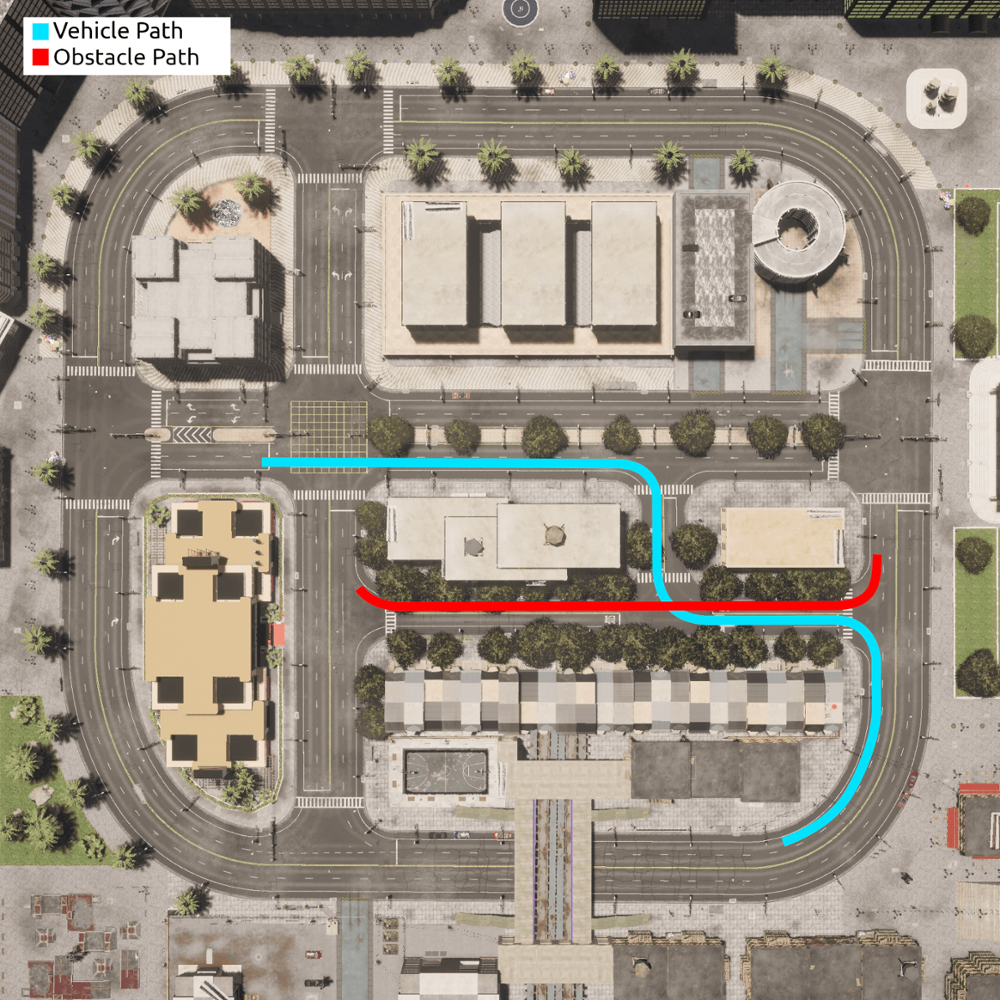
Figure 3b. Stop ABP
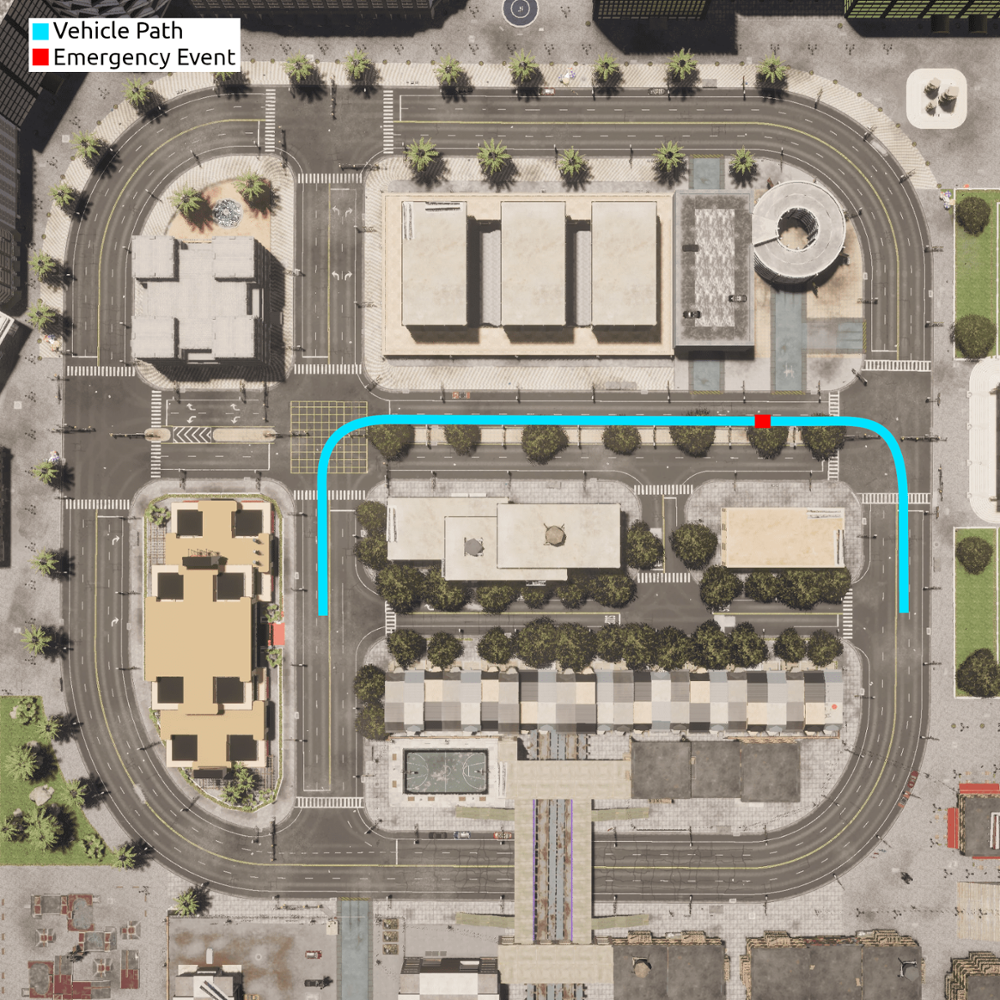
Figure 3c. Critical Failure
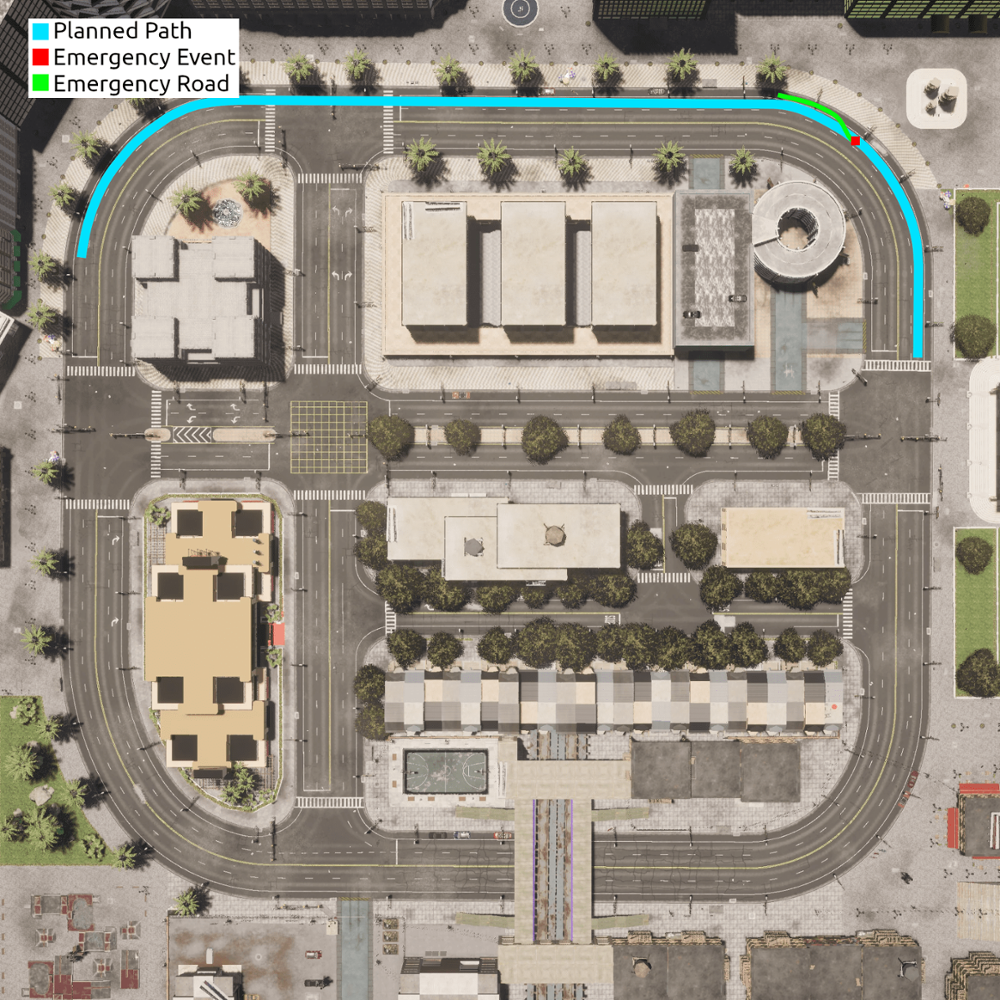
Figure 3d. Sensor Failure.
Figure 4. Result road plans followed with odometry and ABPs.

Figure 4a. Custom ABP Plan

Figure 4b. Stop ABP Plan

Figure 4c. Critical Failure Plan

Figure 4d. Sensor Failure Plan
Figure 5. Vehicle speed and behavior activation during testing.

Figure 5a. Custom ABP

Figure 5b. Stop ABP
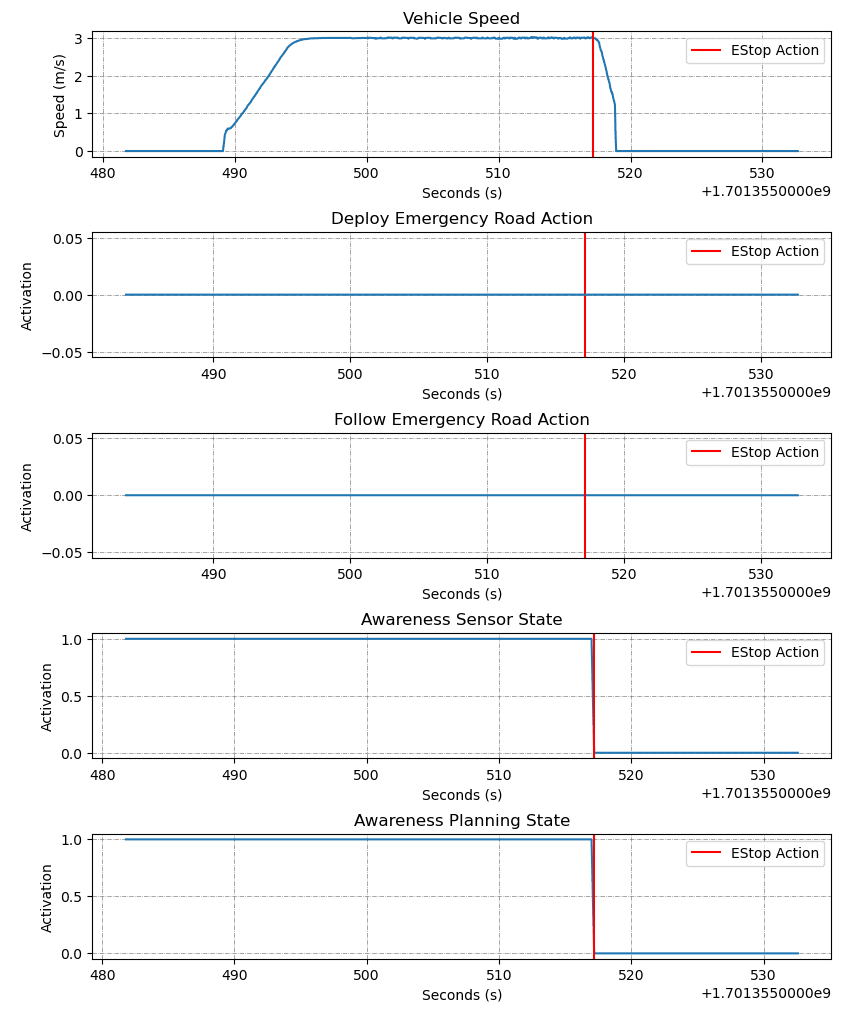
Figure 5c. Critical Failure

Figure 5d. Sensor Failure